
The stock market has been all over the place lately. With the volatility seen in the stock market, it appears that the bears are gaining strength. This aging bull market might get a correction in the near future. This is great news because stocks will be cheap, so it will be the perfect time to buy. In this week’s blog post, I will talk about 3 stocks that are worth buying during the next stock market correction. Let’s dive in.
1. Check Point Software (CHKP)
Check Point Software: Check Point Software Technologies develops, markets, and supports a range of products and services for IT security worldwide. The company offers a portfolio of network security, endpoint security, data security, and management solutions. It provides Check Point Infinity Architecture, a cyber security architecture that protects against 5th generation mega cyber-attacks across various networks, endpoint, cloud, and mobile; security gateways from platforms for small business and small office locations, high end and high demanding data centers, and perimeter environments; and Check Point SandBlast family for threat prevention and zero-day protections. The company also offers Check Point CloudGuard cloud security product that delivers threat prevention security for enterprise cloud networks, data, and applications; Check Point SandBlast Mobile for mobile security in iOS and Android devices; and Check Point Security Management, which offers security management through a single console that streamlines security operations and provides visibility into policy administration and threat analysis. In addition, the company provides technical customer support programs and plans; professional services in implementing, upgrading, and optimizing Check Point products comprising design planning and security implementation; and certification and educational training services. It sells its products and services to enterprises, service providers, small and medium sized businesses, and consumers through a network of channel partners, such as distributors, resellers, system integrators, original equipment manufacturers, and managed security service providers.
Fundamental Overview:
In this day and age, when most of your content is stored on the cloud, the IT security services provided by Check Point Software can be classified as a huge moat. Your privacy can be compromised any second due to cyber attacks, and this is why protecting assets in the cloud is the top priority of any company. Let’s look at the numbers for Check Point Software.
At current price of $112.93 (as of 12/07/2019), the P/E ratio of CHKP is 22.10. The 10 year average Return on Equity (ROE) is 19.42%. Moreover, the company has no long term debt, which means it would be nimble on its feet during a future downturn. The Free Cash Flow to Net Income is 1.37, which has around that number for the past 10 years. The current ratio is 1.63, which implies that the company has ample liquidity to fulfill its current liabilities. The Return on Invested Capital (ROIC) is 21.49%, which has grown from 15.25% back in 2009. Lastly, the operating margin of the company is 47.7%; this means that out of every $100 of sales, the company makes $47.7 profit. The biggest downside to investing in this stock is that it does not pay dividend. So, the only way for an investor to profit is if the stock price appreciates.

Intrinsic Value:
Two of the biggest competitors of Check Point Software are Cisco Systems Inc (CSCO) and Palo Alto Networks (PANW). Although Cisco is financially stable and pays dividends, it’s operating margin is only 27.7% (as compared to CHKP’s operating margin of 47.7%). Similar to Check Point, Palo Alto does not pay dividend. However, for the past 5 years, Palo Alto consistently had a negative operating margin. The biggest reason why I pick Check Point Software over its competitors is its free cash flow generation capability.
I performed a Discounted Cash Flow (DCF) analysis with a 15% discount rate. As pictured below, I found the Intrinsic Value of CHKP to be $90 per share. In comparison to the intrinsic value, the current price of Check Point Software is $112.93 per share. I used a higher discount rate (15%) because I find 10% FCF growth to be aggressive. So, it appears that CHKP is trading at 25% premium above its intrinsic value. Here is the pdf version of the table below.
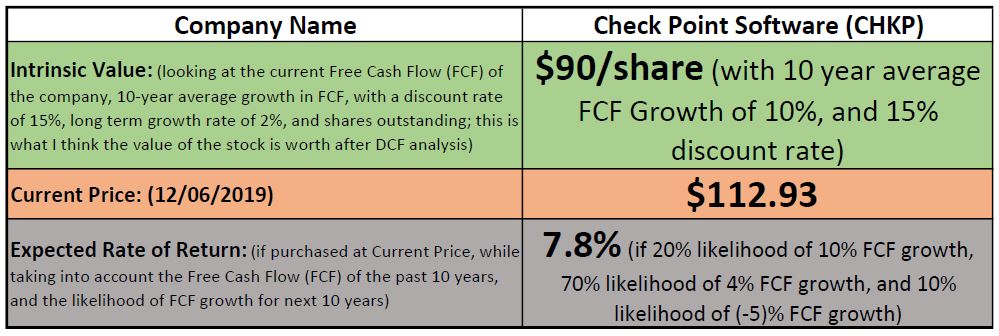
The last row in the table above is for Expected Rate of Return (RoR). If you were to invest your money at the current stock price, the expected RoR gives you an idea of what kind of annual return can you expect to get on that investment for the years to come. Expected RoR takes into account the Free Cash Flow (FCF) for the past 10 years, and the likelihood of FCF growth for the next 10 years. Here are the past and projected FCF arrays along with the Upperband, Lowerband, and Most Likely assumptions for Check Point Software:
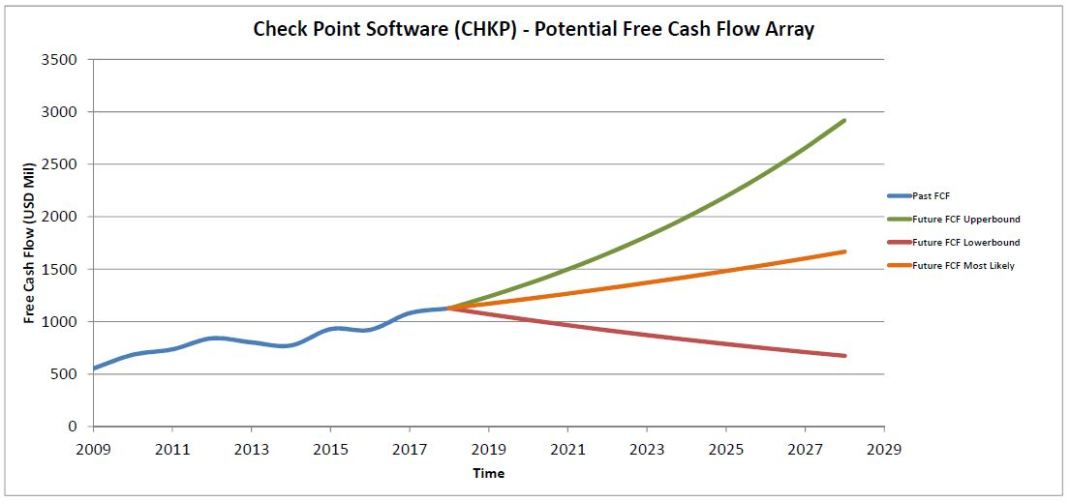
I think that Check Point Software is a good stock to buy during the next downturn. It has a viable business model. The company has had its top line and bottom line increase every year for the past 10 years. Moreover, while taking on no long term debt, the free cash flow has increased from $553 million in 2009 to $924 million in 2019. Even though competition is tough in the cyber security market, Check Point Software is financially well positioned to make any required changes to keep its cash flow going.
2. McCormick & Company (MKC)
McCormick & Company : McCormick & Company, Incorporated manufactures, markets, and distributes spices, seasoning mixes, condiments, and other flavorful products to the food industry. The company operates in two segments, Consumer and Flavor Solutions. The Consumer segment offers spices, herbs, and seasonings, as well as desserts. This segment markets its products under the McCormick, French, Frank’s RedHot, Lawry’s, Club House, Gourmet Garden, and OLD BAY brands in the Americas; Ducros, Schwartz, Kamis, and Drogheria & Alimentari, and Vahiné brand names in Europe, the Middle East, and Africa; McCormick and DaQiao brands in China; and McCormick, Aeroplane, and Gourmet Garden brand names in Australia, as well as markets regional and ethnic brands, such as Zatarain’s, Stubb’s, Thai Kitchen, and Simply Asia. It also supplies its products under the private labels. This segment serves retailers comprising grocery, mass merchandise, warehouse clubs, discount and drug stores, and e-commerce retailers directly and indirectly through distributors or wholesalers. The Flavor Solutions segment offers seasoning blends, spices and herbs, condiments, coating systems, and compound flavors to multinational food manufacturers and food-service customers. It serves food-service customers directly and indirectly through distributors.
Fundamental Overview:
MKC is in the packaged food industry, and consumer defensive sector. According to Motley Fools, consumer packaged retail spices and seasoning are an $11 billion worldwide market and McCormick has a 20% market share, four times its next-largest competitor. Let’s look at the numbers for McCormick.
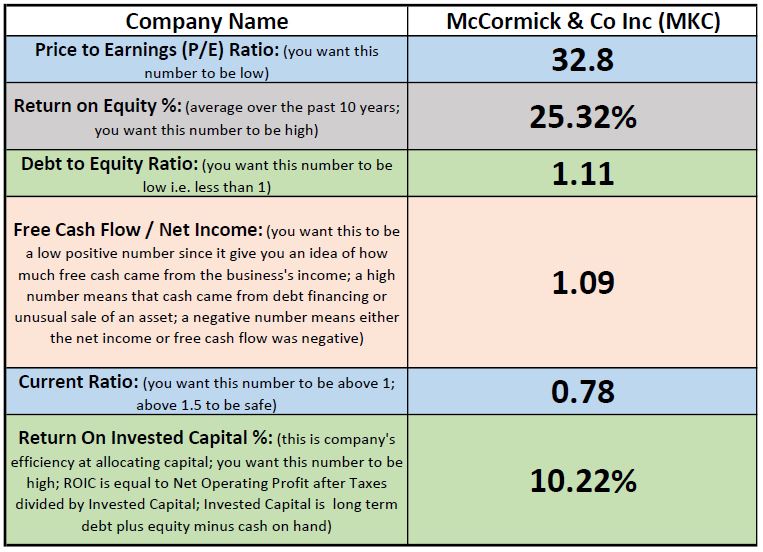
At current price of $171.99 (as of 12/07/2019), the P/E ratio of MKC is 32.8. The 10 year average Return on Equity (ROE) is 25.32%. The Debt to Equity ratio is 1.11; there was a spike in debt to equity ratio in 2017 to 1.73, however this ratio is gradually decreasing. The Free Cash Flow to Net Income is 1.09, which has around that number for the past 10 years. The current ratio is 0.78, which implies that the company does not have enough current assets to fulfill its current liabilities. Similar to the situation with debt to equity ratio, the current ratio was affect back in 2017 and it might take a couple more years for management to get these ratios under control. The Return on Invested Capital (ROIC) is 10.22%, which has been consistent for the past 10 years. Unlike the previous stock recommendation, MKC has paid out dividends for the past 10 years, and has increased the dividend paid out every year. In 2019, MKC paid a dividend of $2.23 per share as compared to $0.96 annual dividend payment in 2009.
Intrinsic Value:
I performed a Discounted Cash Flow (DCF) analysis with a 10% discount rate. As pictured below, I found the Intrinsic Value of MKC to be $113 per share. In comparison to the intrinsic value, the current price of McCormick is $171.99 per share. I used the discount rate of 10% as I though 8.25% FCF growth was reasonable. So, it appears that CHKP is trading at about 50% premium above its intrinsic value. Here is the pdf version of the table below.

The last row in the table above is for Expected Rate of Return (RoR). If you were to invest your money at the current stock price, the expected RoR gives you an idea of what kind of annual return can you expect to get on that investment for the years to come. Expected RoR takes into account the Free Cash Flow (FCF) for the past 10 years, and the likelihood of FCF growth for the next 10 years. Here are the past and projected FCF arrays along with the Upperband, Lowerband, and Most Likely assumptions for McCormick & Co:
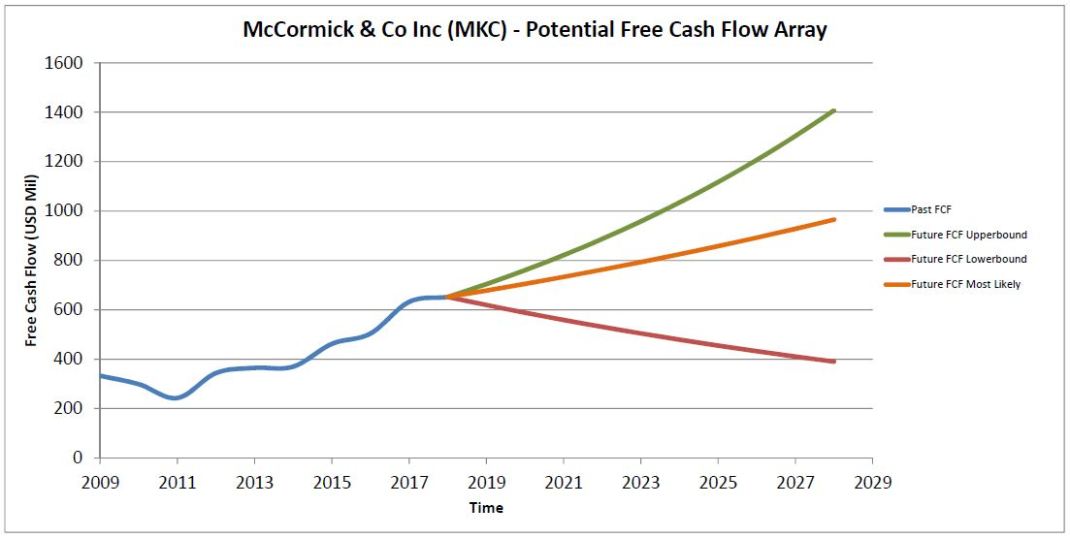
I think McCormick is a good stock, but it is clearly overvalued at this point. A stock market correction should bring this stock to a lower level, where it might be justified to purchase its shares. McCormick is fundamentally strong, so I would put this stock on my watchlist.
3. Becton, Dickinson and Company (BDX)
Becton, Dickinson and Company: Becton, Dickinson and Company develops, manufactures, and sells medical supplies, devices, laboratory equipment, and diagnostic products worldwide. The company’s BD Medical segment offers peripheral IV and advanced peripheral catheters, central lines, acute dialysis catheters, vascular care and preparation products, needle-free IV connectors and extensions sets, IV fluids, closed-system drug transfer devices, hazardous drug detection, hypodermic syringes and needles, anesthesia needles and trays, enteral syringes, sharps disposal systems; infusion pumps and dedicated disposables, medication compounding workflow systems, automated medication dispensing, automated supply management systems, medication inventory optimization and tracking systems; syringes, pen needles, and other products for diabetes care; and prefillable drug delivery systems. BD Life Sciences segment provides specimen and blood collection products and systems; automated blood and tuberculosis culturing, molecular testing, microorganism identification and drug susceptibility, and liquid-based cytology systems, as well as rapid diagnostic assays, microbiology laboratory automation products, and plated media products; and fluorescence-activated cell sorters and analyzers, antibodies and kits, reagent systems, and solutions for high-throughput single-cell gene expression analysis, as well as clinical oncology, immunological, and transplantation diagnostic/monitoring reagents and analyzers. The company’s BD Interventional segment offers hernia and soft tissue repair, biological and bioresorbable grafts, biosurgery, and other surgical products; surgical infection prevention, surgical and laparoscopic instrumentation products; peripheral intervention products; and urology and critical care products.
Fundamental Overview:
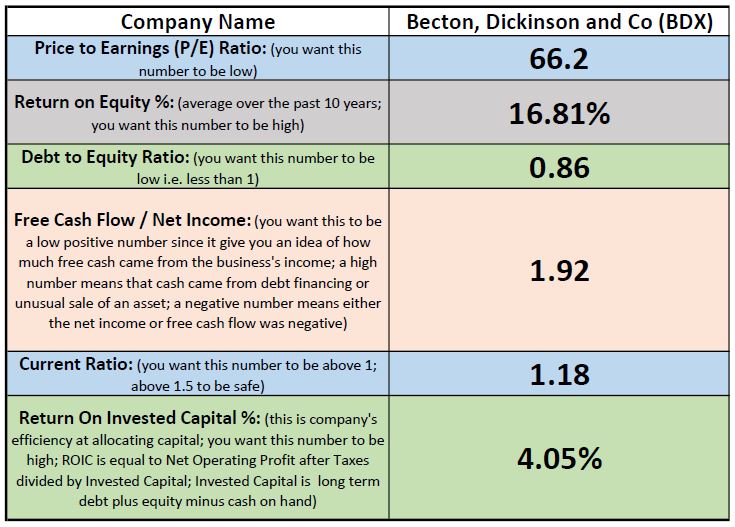
Becton, Dickinson and Company is in the Medical Instruments & Supplies industry, and Healthcare sector. BDX’s medical total segment market share is approximately 44.55%. Let’s look at the numbers for Becton, Dickinson and Company.
At current price of $260.69 (as of 12/07/2019), the P/E ratio of BDX is 66.2. The 10 year average Return on Equity (ROE) is 16.81%. The Debt to Equity ratio is 0.86, which is good. The Free Cash Flow to Net Income is 1.92, which has around that number for the past 5 years. The current ratio is 1.18, which implies that the company has enough current assets to fulfill its current liabilities. The Return on Invested Capital (ROIC) is 4.05%, which is less than the 10 year average ROIC of 10.5%. Moreover, BDX has paid out dividends for the past 10 years, and has increased the dividend paid out every year. In 2019, BDX paid dividend of $3.08 per share as compared to $1.48 annual dividend payment in 2009.
Intrinsic Value:
I performed a Discounted Cash Flow (DCF) analysis with a 10% discount rate. As pictured below, I found the Intrinsic Value of BDX to be $168 per share. In comparison to the intrinsic value, the current price of Becton, Dickinson and Company is $260.69 per share. I used the discount rate of 10% as I though 8% FCF growth was reasonable. So, it appears that BDX is trading at about 55% premium above its intrinsic value. Here is the pdf version of the table below.

The last row in the table above is for Expected Rate of Return (RoR). If you were to invest your money at the current stock price, the expected RoR gives you an idea of what kind of annual return can you expect to get on that investment for the years to come. Expected RoR takes into account the Free Cash Flow (FCF) for the past 10 years, and the likelihood of FCF growth for the next 10 years. Here are the past and projected FCF arrays along with the Upperband, Lowerband, and Most Likely assumptions for Becton, Dickinson and Co:

At the current P/E of 66.2, BDX is clearly overvalued. However, I think it is a good stock to add to your portfolio if you are looking for a financially stable, dividend paying stock. It is definitely a stock worth putting on your watchlist.
Hope you learned a little and found this blog post helpful. We talked about 3 stocks – Check Point Software Technologies (CHKP), McCormick & Company (MKC), and Becton, Dickinson and Company (BDX) – that are worth buying during the next stock market correction. We looked at various fundamental ratios, intrinsic values, and expected rate of returns. As always, you can sign up for our free mailing list here. You can sign up for our paid subscription services here. Like us on our Facebook page here. Thank you!


Superior North LLC’s content is for educational purposes only. The calculators, videos, recommendations, and general investment ideas are not to be actioned with real money. Vyom Joshi is not a professional money manager or a financial advisor. Contact a professional and certified financial advisor before making any financial decisions. Please review the Disclaimer and Terms and Conditions.
