
Dow Jones Industrial Average (DJIA) was down 460 points and S&P 500 was down 54 points when the market closed on Friday, March 22nd, 2019. This sell off was due to the presence of inverted bond yield curve. Last time there was such an inversion was in January 2006. The inverted yield curve is one of the leading indicators of a recession. In this blog post, I will talk about what is an inverted bond yield curve, how does it happen, and how accurate is it at forecasting a recession.
Before we start talking about inverted bond yield curve, it is important that we understand what bond price and bond yield is. Think of bond price as what you pay for the bond, and the bond yield as the return (coupon or interest payment) from that bond. You will get a higher return if you are buying the bond below its face value (for cheap), and a lower return if you are buying the bond above its face value (expensive). This is when I should point out that bond prices and bond yields are inversely related. In other words, when the bond price goes up, the yield falls. When bond price falls, the yield goes up. Consequently, the yield goes up when bond prices fall, and yield goes down when bond prices rise. This concept of bond yield and bond price is similar to that of dividend yield and stock price.
The yield curve is said to be inverted when a longer maturity bond has a lower yield than the yield of a shorter maturity bond. On Friday, the yield for the 10 year treasury note (at 2.44%) was lower than that of the three month treasury bill (at 2.45%). This happens when bond traders believe that the long term future of US Economy is weak. As interest rates are likely to fall during a slowdown/recession, the bond trades want to lock in the current yields. In order to do so, they start buying long term bonds. This buying pressuring drives up the bond prices. As bond prices rise, yields falls. So, as traders started buying the 10 year treasury note, the yield for the 10 year treasury note fell. As an investor, you would want your 10 year investment to pay a higher return than a 3 month investment since you have locked in your money for a longer duration. However, now, investors get a higher rate of return on their 3 month investment than their 10 year investment. Friday was an important day because it was the first time in 13 years when bond yields were inverted. The figure below shows the past 3 recessions, which began within 2 years of yield curve inversion.
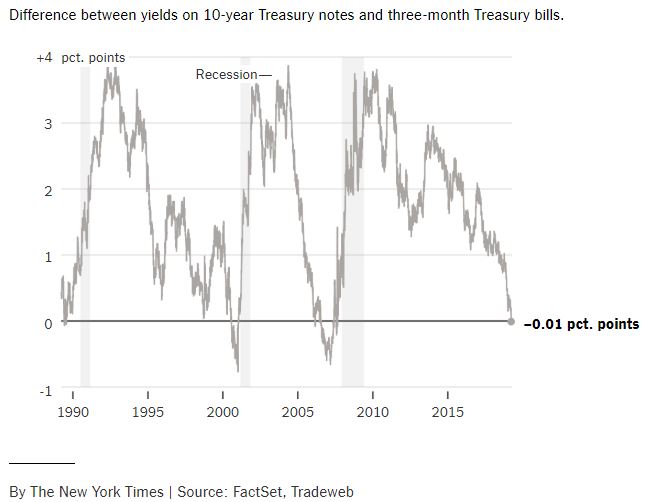
According to this economic letter published last year by the Federal Reserve Bank of San Francisco (FRBSC), the term spread, which is the difference between long term and short term interest rates, is a very accurate indicator of future economic activity. Every US recession in the past 60 years was preceded by a negative term spread i.e. an inverted yield curve. Lastly, inverted yield curve was ALWAYS followed by an economic slowdown, and except for one time, by a recession.

Hope you learned a little and found this blog post helpful. We talked about bond yield, bond price, and their correlation. Hopefully you got a better idea of what an inverted bond yield curve is and its implication. As always, you can sign up for our mailing list here. Like us on our Facebook page here. Thank you!


Email us at: superiornorthllc@gmail.com
Superior North LLC’s content is for educational purposes only. The calculators, videos, recommendations, and general investment ideas are not to be actioned with real money. Contact a professional and certified financial advisor before making any financial decisions.
