
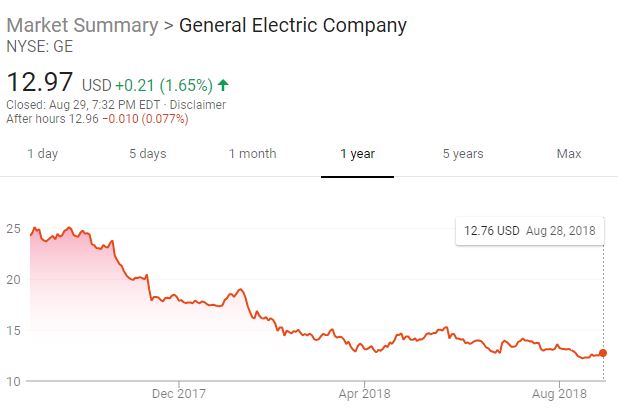
Ever since Jack Welch left, it seems that GE just can’t seem to be that blue chip that it once used to be. Some claim that Jack Welch is the reason why GE is in this tough position. They say that he set GE up for failure. Recently, GE has been selling off some of its assets such as healthcare technology, distributed power business, and industrial engines. John Flannery, the current CEO of GE, wants to focus on the core business of GE. Mr. Flannery envisions that by paying attention to and growing the core money making business, he can bring GE back on track. Within this past year, GE shares have dropped by more than 50%, with the stock currently trading at $12.97. Furthermore, this once upon a blue chip has been kicked out of the Dow Jones Industrial Average.
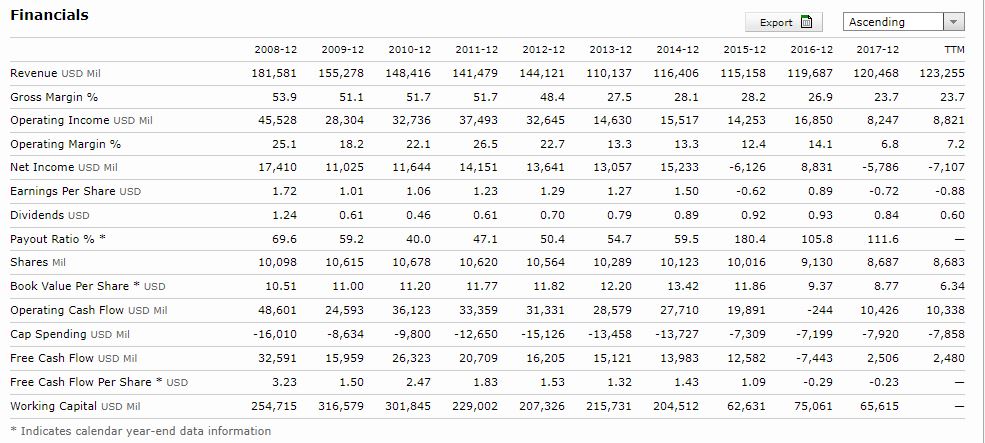
Do you think GE is now one of those looked down upon stock which might actually be undervalued? GE’s Debt to Equity ratio is 1.69, which is better than its 2008 Debt to Equity ratio of 3.15. I personally do not like it when this ratio is greater than 1. But if you are looking at progress, it does look like GE is trying to improve by reducing its debt obligations. In contradiction, it is also worth looking that the company’s Inventory Turnover ratio was at 6.31 in 2008, and was 4.15 in 2017. The inventory turnover ratio shows how many times a company sold its total average dollar inventory. The numbers that look the scariest to me are the Free Cash Flow numbers. In 2008, GE reported Free Cash Flow of 32,591M, and the Trailing Twelve Month (TTM) Free Cash Flow is of 2,480M. This is a big reduction in cash flow. GE’s Net Income looked stable until 2014, and in the recent years it has reported negative income. The company’s book value has been on a steady decline since 2014.
I tried to compute the intrinsic value of GE by doing a DCF calculation. I used the following information and assumptions:
| Current Free Cash Flow: | 2,506 | BYFCF (base year free cash flow) |
| Annual Growth Rate of FCF (or % revenue): | 0.65 | % |
| Discount Rate: | 10 | % |
| Long Term Growth Rate: | 3 | % |
| Shares outstanding: | 8691.08 | M |
| DF = Discount Factor |
| FCFn = Free Cash Flow for year n |
| DFCFn = Discounted Free Cash Flow for year n |
| DPCF = Discounted Perpetuity Cash Flow |
| Year | FCF mult | FCFn | DF | DFCFn |
| 1 | 1.0065 | 2522.289 | 1.1 | 2292.99 |
| 2 | 1.01304225 | 2538.683879 | 1.21 | 2098.08585 |
| 3 | 1.019627025 | 2555.185324 | 1.331 | 1919.748553 |
| 4 | 1.0262546 | 2571.794028 | 1.4641 | 1756.569926 |
| 5 | 1.032925255 | 2588.510689 | 1.61051 | 1607.261482 |
| 6 | 1.039639269 | 2605.336009 | 1.771561 | 1470.644256 |
| 7 | 1.046396925 | 2622.270693 | 1.9487171 | 1345.639494 |
| 8 | 1.053198505 | 2639.315453 | 2.14358881 | 1231.260137 |
| 9 | 1.060044295 | 2656.471003 | 2.357947691 | 1126.603026 |
| 10 | 1.066934583 | 2673.738065 | 2.59374246 | 1030.841768 |
| Sum of DFCF: | $ 15,879.64 |
| DPCF: | $ 13,878.81 |
| Intrinsic Value: | $ 29,758.46 |
| Intrinsic Value per share: | $ 3.42 |
After all that calculation, I end up with intrinsic value per share of $3.42, so with a 10% discount rate, it seems that GE might not be the best investment out there. What do you think? Do you think this stock is beaten down enough that it is bound to rebound?

Check out our Facebook page here.
Sign-up on our Mailing List here.
Email us at: superiornorthllc@gmail.com
