
Have you ever wondered when is the right time to buy or sell a stock? In this blog post, I will talk about 3 technical indicators/oscillators, which can help you make a better decision about when to enter or exit the market.
Parabolic Stop And Reversal (SAR)
Parabolic SAR helps us identify where a trend ends. You can use Yahoo Finance to add this indicator to any stock. Let me illustrate Parabolic SAR with the example of Apple Inc.
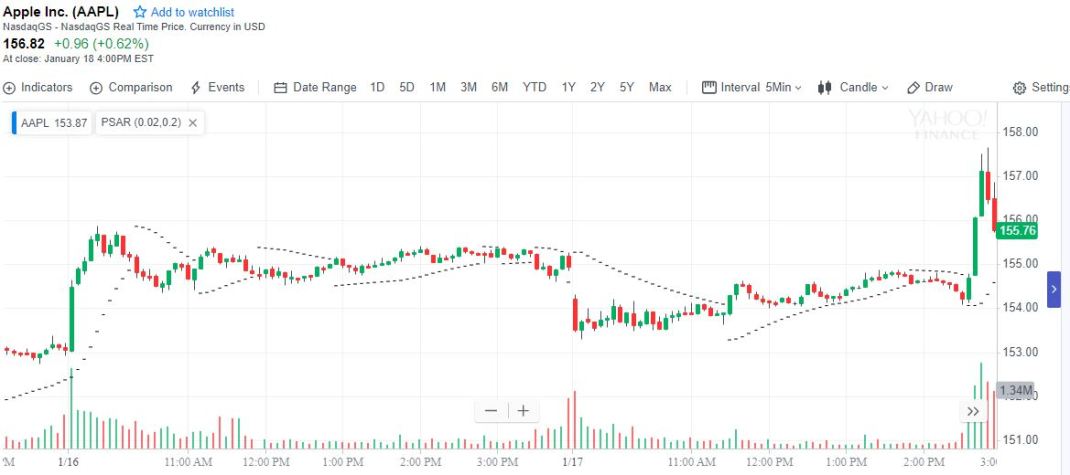
You will notice that when you add the Parabolic SAR indicator, you will see dots above or below the candles. When dots are below the candle, it is a BUY signal. When the dots are above the candle, it is a SELL signal. You can see from the Apple example above that the dots are below the candles when the price is rising, and the dots are above the candles when the price is falling. Note: Parabolic SAR is most effective when the market/stock is trending.
Relative Strength Index (RSI)
RSI helps us identify overbought and oversold conditions. You can use Yahoo Finance to add this indicator to any stock. Let me illustrate RSI with the example of AMD stock.

You will notice that when you add the RSI indicator, you will see another window pop up underneath the price chart. The x-axis will be time, and the y-axis will range from 0 to 100. When the RSI indicator drops below 30, it is an oversold condition. On the other hand, when the RSI indicator goes above 70, it is an overbought condition. Ideally, you want to buy the stock in an oversold condition, and sell the stock in an overbought condition. In the example above, we can see that on 1/17, the RSI indicator dropped below 30. This would have been a good opportunity to buy AMD stock.
Average Directional Index (ADX)
“The trend is your friend”. ADX is an oscillator (ranges from 0 to 100) which tells us if it is okay to jump in on an ongoing trend. ADX gives us an idea if the the stock is ranging or starting a new trend. Let me illustrate ADX with the example of Intel stock.

You will notice that when you use ADX indicator, you will have another window pop up underneath the price chart. Similar to RSI, the x-axis on the ADX chart is time, and the y-axis ranges from 0 to 100. ADX below 20 indicates a weak trend, and ADX above 50 indicates a strong trend. When ADX falls below 50, you should lock in your profits. In the example above, we can see that ADX for Intel went above 50 (indicating strong trend) towards the end of October. If you considered trend to be your friend, you would have taken this opportunity to buy INTC stock at around $40/share. Towards the end of November, ADX dropped below 50, which is a good time to exit the trade at around $44/share. If you were to exit then, you would’ve made a profit of around $4 per share.
While trading, you get the best results when you combine different indicators together. For example, your probability of entering a successful trade is increased if you would combine ADX with buy/sell indicator such as Parabolic RSI or SAR rather than just using only one indicator. Also note that higher time frame charts (4h, 1d, 1w) are more reliable than lower time frame charts (5m, 15m, 1h).

Hope you learned a little and found this blog post helpful. We talked about 3 technical indicators – Parabolic SAR, RSI, and ADX, which could give you a better idea about when to enter or exit a trade. As always, you can sign up for our mailing list here. Like us on our Facebook page here. Thank you!


Email us at: superiornorthllc@gmail.com
Superior North LLC’s content is for educational purposes only. The calculators, videos, recommendations, and general investment ideas are not to be actioned with real money. Contact a professional and certified financial advisor before making any financial decisions.
